
- Power BI Slicers - A Definitive Guide
- How to Download and Install Power BI Desktop
- How to Share Reports in Power BI for Mobile
- Power BI Architecture: A Complete Tutorial with Diagram
- Power BI Career Opportunities
- What are the Components of Power BI?
- DAX In Power BI - Learn Power BI DAX Basics
- Power BI Tutorial - Power BI Desktop Tutorial
- Power BI Interview Questions and Answers
- Power BI Services and Benefits
- Power BI Visuals List and Chart Types
- Power Apps Interview Questions and Answers
- Power Apps Tutorial
- What is Power BI? The Definitive Guide
- What is Power Apps?
- Top 15 Data Visualization Tools
- Power BI Projects and Use Cases
- Power BI Vs QlikView
- Power BI Heatmap
- Power BI Gateway - Power BI Gateway Architecture
- Power BI vs SSRS - What are the Differences
- Power BI Dashboards vs Reports - Which is better?
Power Pivot and Power Query frequently complement one other. When it comes to importing data, Power Query is the first thing that springs to mind. Power Pivot, on the other hand, manages the data modeling that you just loaded.
Both of these can help you find numerous things to comprehend in Power BI, PivotTables, and PivotCharts. Let's begin by comparing Power Pivot vs Power Query.
Below are the topics we will be covering in this article:
| Table of Content - Power Pivot vs Power Query |
|
➤ Why do you Need Power Query? ➤ Different Phases of Power Query ➤ What is the use of Power Pivot? ➤ How do these tools work together? |
What is a Power Query?
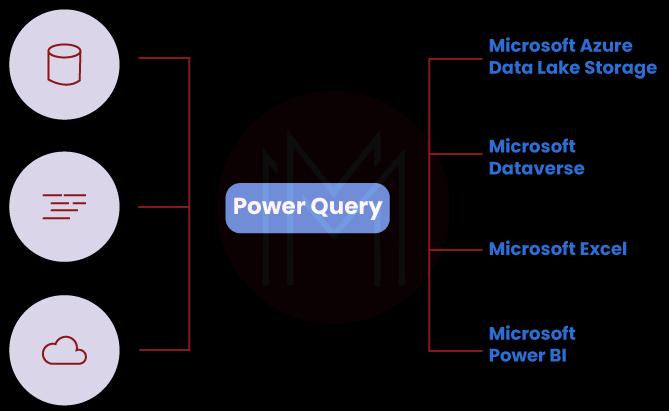
Power Query is a data preparation and transformation engine. Power Query offers a graphical interface for getting data from sources and a Power Query Editor for doing transforms. The Power Query application selects the data's final destination because the engine is incorporated into so many products and services.
In an ETL, the Power Query tool is an Excel add-in. When you utilize this program, you'll be able to extract data from various sources, manipulate it into a format that meets your needs, and then load it into Excel.
| If you want to enrich your career and become a professional in Power BI, then enroll in "Power BI Online Training" - This course will help you to achieve excellence in this domain. |
Why do you need a Power Query?
- Data may be downloaded to Excel from nearly 40 different sources, including databases such as SQL, Oracle, Access, and Teradata, corporate ERP systems such as SAP and Microsoft Dynamics, and Internet services such as Facebook and Google Analytics.
- Collect data from all fundamental data kinds, including XLSX, TXT, CSV, JSON, and HTML, from all files in the specified folder, both individually and in bulk. You can automatically download data from all sheets in an Excel spreadsheet.
- Cleaning the data of "waste" such as repetitions, additional columns or rows, extra spaces or unprintable characters, and so on are included.
- Make the right data sequence, such as the correct case fill in the gaps, number as text, dismantle the text, add the correct table header, divide the data into components, and so on.
- You can make adjustments to the tables by putting them in your preferred view, such as filtering, sorting, transposing, changing the order of columns, adding totals, transposing, expanding cross-tables into flat ones, and rolling back.
Versions of Power Query
There are two versions of Power Query:
Excel add-in: It is available for free download as part of Excel 2016 from Microsoft's official website. When the add-on is installed, Excel creates a new tab for it.
Built-in Functionality: Power Query functionality is built-in by default and is available on the Data tab as a collection of getting and Transform commands.
However, the functions are the same regardless of how they were obtained. This add-on is popular since it can be helpful in a variety of situations. Many fussy jobs, such as formulas or macros, must have grabbed you. Power Query is a godsend for anyone tired of doing these time-consuming chores daily. Even if you are a beginner, Power Query is unmatched.

Different Phases of Power Query
There are four phases to using Power Query:
- Connect
- Transform
- Combine
- Load

Connect
Connect to data in the cloud, on a service, or on your local machine. You can use Power Query to import data to a single data source, such as an Excel worksheet, or numerous databases, feeds, or cloud services. Web data, files, databases, Azure, and even Excel tables in the current worksheet are examples of data sources. You can then use Power Query to combine those data sources and unearth insights you wouldn't have seen otherwise.
Transform
Shape data to fit your needs while keeping the source intact. To transform data, you must change it in some way to satisfy your data analysis needs. You can remove a column, modify the data type, and filter rows. Shape data is the method of assigning transformations to one or more pieces of data.
Combine
Combines data from several sources to create a distinct perspective on the data.
In your Excel workbook, you can append or merge numerous queries. Append and Combine operations can be used on any query having a tabular shape, regardless of the data source.
Load
Finish your query, save it to a spreadsheet or Data Model, and update it regularly.
You can load queries into your workbook in two ways:
- Close and Load commands in the Close group on the Home tab can be used from the Power Query Editor.
- You can right-click a query in the Excel Workbook Queries window (Select Queries & Connections) and choose Load To.
You may also fine-tune your load options by going to File > Options and settings > Query Options and selecting how to see your data and where to load it, whether in a spreadsheet or a Data Model.
| Related Article: Career Opportunities of Power Bi |
What is Power Pivot?
Power Pivot is an Excel add-in that allows you to perform advanced data analysis and model building. You can connect together massive amounts of data from numerous sources with Power Pivot, do rapid information analysis, and simply share findings.
A Data Model, a group of tables with relationships, can be created with Excel and Power Pivot. The data model in an Excel worksheet is the same as in the Power Pivot panel. Any data you upload into Excel is also available in Power Pivot.
What is the use of Power Pivot?
Instead of putting data on a worksheet, Power Pivot lets you enter it straight into a data model. Additionally, you can link tables together. Say goodbye to the Vlookup function, which combines data into one large table. Power Pivot allows you to generate pivot tables based on a data model and evaluate numerous tables at once.
The DAX (Data Analysis Expressions) function is also used by Power Pivot. Compared to conventional Pivot Table, DAX has a more extensive vocabulary and can do more complicated computations.
Here is a list of general rules to work with Power Pivot:
- When you load data into Power Pivot, you'll see that it supports 15 different sources, such as standard databases like SQL, Oracle, and Access, as well as text files, Excel files, and data feeds.
- Furthermore, Power Query may be used as a data source file, allowing you to analyze comprehensively.
- The tables are linked together to aid in the future creation of reports based on the preceding tables.
Other features that make Power Pivot an excellent tool for particular tasks include:
- In contrast to Excel, this application does not have line restrictions. You may load and work at any size table.
- Power Pivot is excellent for compressing data when loading it into the Model. You're probably aware that a 50 MB text file can be reduced to 3-5 MB after downloading.
- Although Power Pivot is not public or open to everybody, it can easily handle extensive data.
How do these tools work together?
- It is not necessary to use both Power Query and Power Pivot. They are separate tools, and you may only require one of them.
- Massive but straightforward datasets can be prepared for analysis with Power Query. Excel worksheet functions and PivotTables alone are insufficient for increasingly complicated models and calculations.
- These two tools complement one another, even though they can be used independently. Although Power Pivot has options for importing and sharing data, it is advised that you use Power Query instead.
- The data is again put into Power Pivot, which uses DAX to form relationships and create metrics.
| Related Article: A Complete Guide of Power BI Tutorial |
How Power Query and Power Pivot are related?
Here's a quick illustration to show how these powerful tools are linked:
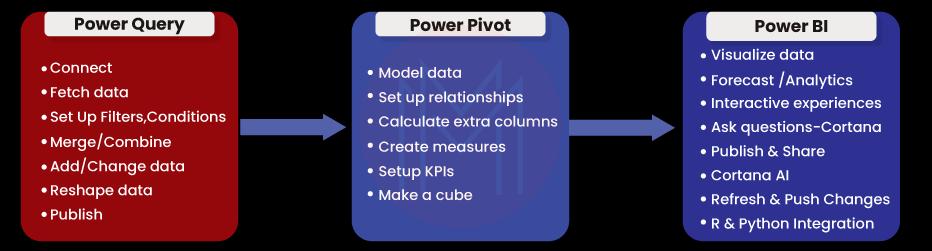
Power Pivot vs Power Query
Power Query and Power Pivot are, as previously stated, the most complementing tools. Power Query is the finest choice for finding, importing, and linking data.
On the other hand, Power Pivot is utilized in Excel for data analysis and modeling. Power Pivot is an excellent tool for modeling imported data.
Excel's Power Pivot and Power Map features are widely used to view and visualize data. Pivot Tables include Power View, Pivot Tables, and Pivot Charts. In a word, Power Query allows you to import data into Excel, whether it's in worksheets or the Excel Data Model, and Power Pivot allows you to add wealth to the Data Model.
| Power Query | Power Pivot | |
| Role | Import and shape data | Data modeling and calculations |
| Language | M | DAX |
| Key Strengths |
|
|
Conclusion
Now that we've reached the end of this blog, Power Pivot and Power Query are fantastic tools for obtaining and transforming data and creating interactive reports and dashboards. These two powerful tools can help you beyond Excel's physical constraints and calculations.
If you want to go further with Excel, MindMajix has dedicated courses on Power BI that will quickly get you up to speed.
 On-Job Support Service
Online Work Support for your on-job roles.

Our work-support plans provide precise options as per your project tasks. Whether you are a newbie or an experienced professional seeking assistance in completing project tasks, we are here with the following plans to meet your custom needs:
- Pay Per Hour
- Pay Per Week
- Monthly
| Name | Dates | |
|---|---|---|
| Power BI Training | Apr 29 to May 14 | View Details |
| Power BI Training | May 03 to May 18 | View Details |
| Power BI Training | May 06 to May 21 | View Details |
| Power BI Training | May 10 to May 25 | View Details |

Madhuri is a Senior Content Creator at MindMajix. She has written about a range of different topics on various technologies, which include, Splunk, Tensorflow, Selenium, and CEH. She spends most of her time researching on technology, and startups. Connect with her via LinkedIn and Twitter .


