What is Power BI? The Definitive Guide
The world of technologies depends more on sharing data by overcoming the concept of ‘ time and space’. Business Intelligence [BI] is nothing but a platform that enables the clubbing of various data under one forum and enables multiple users to access and edit it. By this means, business firms keep their stakeholders well-informed and are also benefited financially. In this article, we'll discuss 'what is power bi' in detail.
What Is a Power BI - Table of Content
- What Makes Power BI Unique and Significant
- What are the Advantages of Power BI
- Disadvantages of Power BI
- Why has Power BI been Developed, How, and by Who
- Different Versions of Power BI and Its Updates
- Power BI Architecture
- How Does Power BI Work
- List of Data Sources of Power BI
- Major Companies Using Power BI
- Pricing and Market Share of Power BI
What is a Power BI?
Power BI is a user-friendly solution developed by Microsoft to handle the business analytics services like data visualization, sharing of such data through your company’s data line, and connecting various data sources from across the world just to enable the end-users to edit, modify and use these data for their own presentations, dashboards and reports.
There are more than 3 versions of Power BI which can be used in different operating systems. Power BI also has the ability to present the data from the past, data from the present and can also make forecasts to predict what is going to happen in the future.
On the whole, Power BI is nothing but a mixture of both SaaS (Software-as-a-service) and a desktop application that uses the properties of the cloud to store various data and to be accessed by various users for multiple purposes.
If you need to boost your professional credibility and prestige within your own network, then learn Power BI from Mindmaji'x Power BI Online Training Course
What makes Power BI Unique and Significant?
Power BI, unlike other related applications, has its own difference and properties which has motivated many to use it, since its initiation by Windows.
Here are the Main Features of Power BI that will help you understand it better:
- One of the main features of Power BI is to enable the collection of various data schema through a well-established channel in order to gain a common data model for various purposes.
- Power BI also allows its end-users to analyze, edit and share data. This makes it easy for firms to review their insights and downfalls without much strain.
- Another important feature of Power BI is that it carries artificial intelligence inside it and this allows the users to use automated machine learning features to generate various models for learning about machines, even images, and texts in Power BI can be accessed, edited, and analyzed. Even the model that carries the Azure Machine Learning forum can also be accessed as it’s already integrated.
- Power BI also powers the work of Microsoft’s digital assistant, called Cortana, which works similar to that of Google’s. Voice recognition search results are its main feature and are seen in mobile phones than in any other electronic device.
- Power BI is able to draw a connection between various data sources from various locations like Salesforce, Microsoft and etc., through its ‘built-in connector tools’.
- In order to get Power BI loaded in the software products or electronic goods, a few sample codes and the Application Performance Interfaces are used by the developer and this feature gets to be called ‘APIs for Integration’.
- Power BI’s feature of ‘Modelling’ enables the users to simplify even the complex data models into simple and understandable diagrams, charts, objects, and other forms. These are then viewed, modified, and are stored in similar folders for easy access.
- Power BI has another interesting feature which is called the ‘Power Query’. This helps one to generate ingested data (data that are integrated, transformed, and enriched) in order to share them to various Power Bi dashboards, reports, and forums.
- Power BI has its own types which relate to Power BI Services which reports to the cloud-based BI functions of Power BI. Power BI Desktop functions as a storage space for various data and is also evident in finding and preparing various essential data. Power BI Embedded can have the custom Power BI visualizations stored in them and are connected with the Azure cloud platform.
- Various data sources can be related to Power BI. Even Excel spreadsheets, which are the base for Power BI and other cloud-based applications are all used by Power BI.
- Power BI not only works on desktops but is also applicable in mobiles and other electronic devices. It works on any operating system, be it Android or iOS, Power BI is supported.
In short, Microsoft Power BI is nothing but a business analytics solution that works on the cloud to get the data edited visually and be analyzed by the end-users without much strain.
| Want to be part of a power bi real-time environment? practice Mindmajix's Power BI Interview Questions |
What are the Advantages of Power BI?
- One of the main advantages of using Power BI is to have the data viewed and edited in ways never followed before as various tools are included from various sources.
- Data can be accessed and edited in no time with innovative and up-to-date tools.
- Even the dull subjects can be viewed in the most interesting manner as the visualizations offered by Power BI and its tools are new and interactive.
- As Power BI uses the cloud, the hurdles caused by ‘time and space’ are overcome.
- One can either use the already existing visuals or can develop a new one that attributes to satisfy the wants of the users.
- In terms of group work, Power BI is the best platform as the same data can be viewed by all the members of the group from their comfortable locations. Apart from this, a company can access its various data from various inside groups through the cloud and the internet. This feature of collaboration can be applied to those users who want to access a company’s data from outside the firm.
- Power BI and its various other versions enable the users to always stay updated about business data and the ways to customize and access it. Even certain alerts can be placed in order to know about a few significant insights.
- Power BI is always checked and updated or re-built from time to time just to make sure it stays fresh and new. This helps the users to avoid using outdated forums for data collection and updating.
- One can also access the data present in Power BI from its central saved location from anywhere at any time and for as many times as the users want.
- Power BI is nothing but a self-service BI which makes it the most popular BI to date and one of the best inventions of Microsoft. This brand image motivates users to trust and choose Power BI whenever necessary.
- Various data sources like Excel, Facebook, Azure sources, SQL Services, online services, and cloud-based services are all linked and connected in Power BI.
- The factors of a secure gateway, hybrid configuration are all applicable in Power BI which makes data sharing and accessing an easy and secure task and is also affordable to all.
While these points constitute the merits of using Power BI,
[ Related Article: Power BI vs SSRS ]
There are a few disadvantages when one uses Power BI and they are:
Disadvantages of Power BI?
- It is important for the Power BI developer to ensure that its data models are crafted without any errors as the table relation followed by Power BI will enable it to easily get confused with complex relationships between various data. Therefore, the data model has to be precise and the data has to be stored and accessed accordingly.
- As Power BI has many tools, the workspace does seem crowded with many options. The user may find it difficult to work in such a crowded user interface.
- Though Power BI has some innovative and attractive visual edits for the data, it is still limited, and not all users get their wishes fulfilled by Power BI.
- Power BI works on DAX language which makes it difficult for the users to use it as DAX is a rigid language and does not support the users’ inputs in some cases, making it impossible for the users to use Power BI and its tools.
- The storage space in Power BI’s free version is limited to 2GB only (approx.). However if one needs more storage space then one has to pay to expand.
- Another common drawback of Power BI is its inability to comprehend more data which sometimes causes Power BI to hang or delay the process.
- However, another drawback in accessing the data in Power BI is limited to those who share the same email domains.
Even when Power BI seems to have these many disadvantages, it is still one of the most popular and most-used forums for accessing, storing, sharing, and editing data across the globe.
[ Do you Know -- What is Power BI Slicer ]
Why has Power BI been Developed, How, and by Who?
One needs Power BI :
-
Accessing, analyzing, and monitoring the required data from any application or device.
-
Developing an interesting set of data with more visuals, graphs, and other extra elements helps in explaining the concept behind those stored data, better.
-
Creating attractive and informative reports and
-
Bringing inconsistency in the reports and analysis submitted in the company.
These are the reasons which motivated the developers to develop a program like Power BI which is now praised and used by many and also by some of the top-most business companies in the world.
The Launch and Development of Power BI:
The following table of details will provide answers for Who and How Power BI was developed.
| First Conceivers | Thierry D’Hers & Amir Netz |
| First Developer | Ron George |
| Company | Microsoft |
| First Name of The Project & Details | Project Crescent in 2010. This was available to the public in 2011. |
| Initial Properties of Power BI | Consisted of various SQL Server Codename Denali. |
| Launch of Power BI | Project Crescent was renamed Power BI and was released by Microsoft in 2013 under the name of “Power BI for Office 365”. |
| Power BI' Base | Microsoft Excel’s add-ins: Power View, Power Pivot, and Power Query. |
| Data of Power BI's Launch to Public Use | 24th July 2015 |
| Stable Release | 123 |
| Recent Valedictions | Due to the merits and features of Power BI and also its success stories, the “2019 Gartner Magic Quadrant for Analytics and Business Intelligence Platform” declared Microsoft as the “Leader”. |
Tableau vs Power BI
Different Versions of Power BI and Its Updates:
Power BI is not an independent element but has many branches and various versions to keep itself updated, equipped, and multi-dimensional.
Different Versions of Power BI Based on Pricing are:
-
POWER BI FREE
-
POWER BI PRO and
-
POWER BI PREMIUM
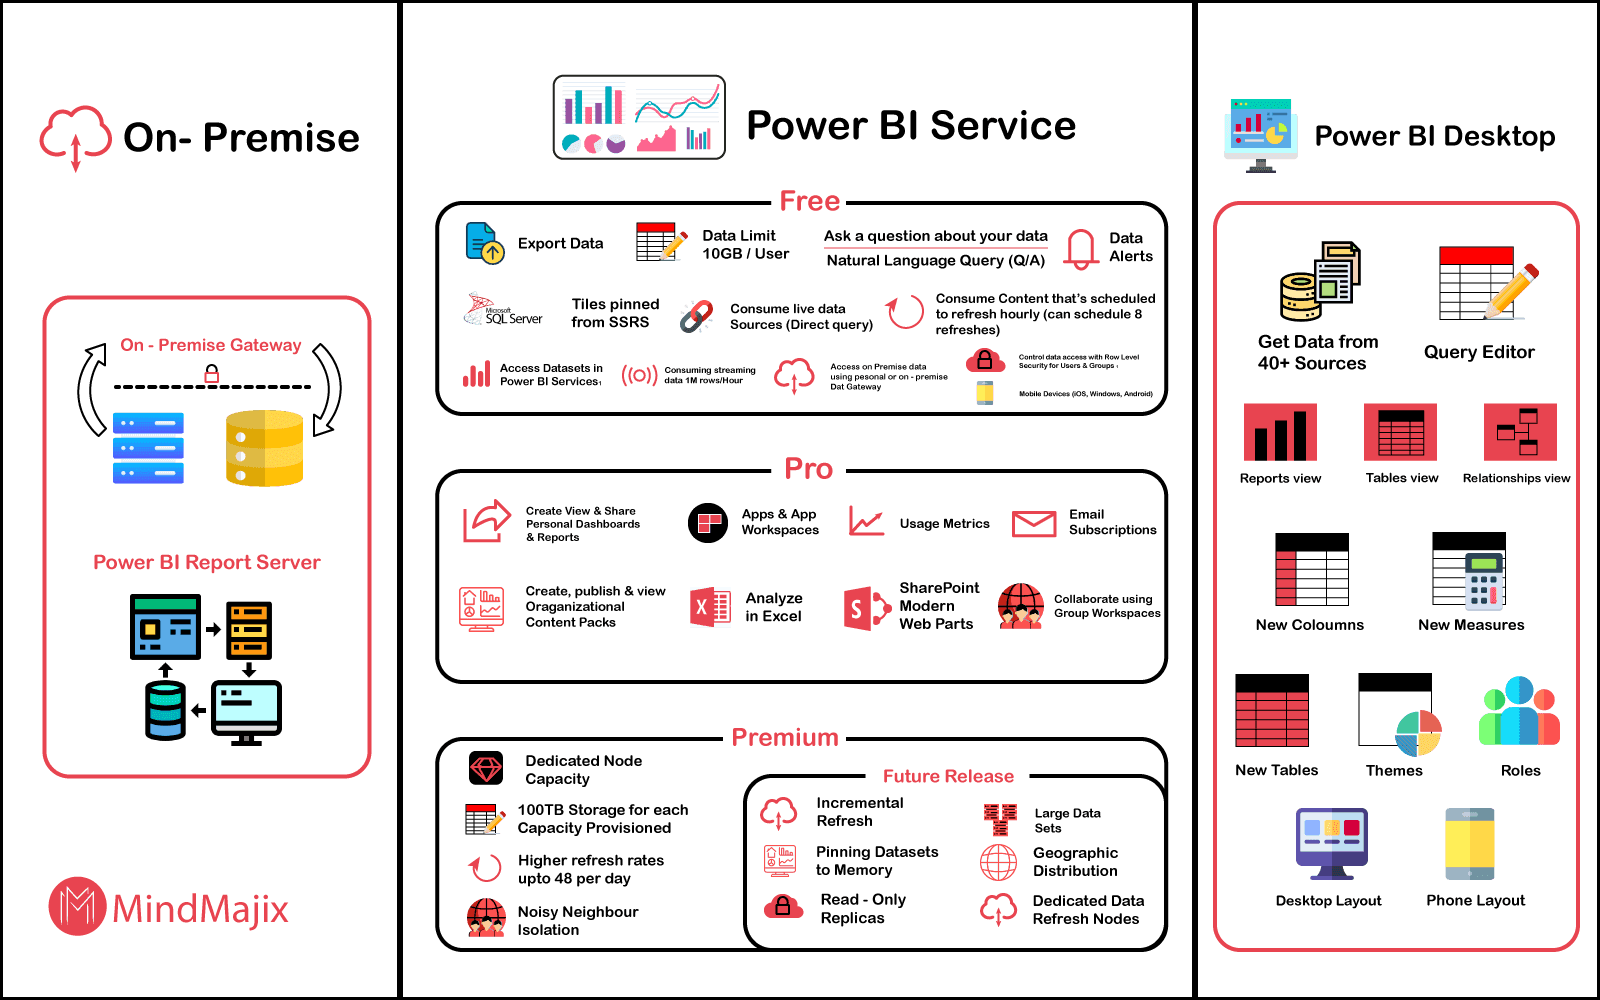
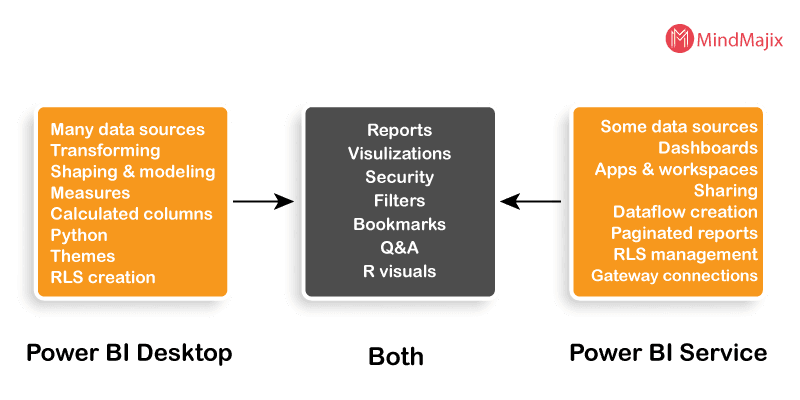
Apart from these 3 versions, Power BI also has other versions like:
-
POWER BI DESKTOP
-
POWER BI SERVICE
The comparison between these 2 types is presented in the picture below.
3. POWER BI MOBILE.
4. POWER BI EMBEDDED.
5. POWER BI REPORT SERVER.
These are the various other versions of Power BI which you can choose after analyzing the rate, functions, merits, and demerits of each version. Most importantly, see which version best suits your interest and work culture and choose accordingly.
In terms of getting new updates from the developer of Power BI, one need not worry as Microsoft releases a new update frequently/monthly and has been consistent so far in doing the same.
In order to grab these regular updates, the user will have to either get the latest version of Power BI installed on their device or can use Windows 10 to claim Power BI Desktop and then use the updates.
Power BI Architecture:
The architecture of Power BI to connect various technologies just to make them work as one is not a complicated business but is quite a simple structure that consists of different functions like Data collection from various data sources, followed by Data cleaning, verification, processing, and transformation.
Once the collected data is edited, reports for those data are prepared and published in either Power BI Service or Power BI Report Server platforms. These published reports can then be used to prepare dashboards that can be shared both inside and outside of the firm.
[Related Page: Power BI Architecture Detail Guide ]
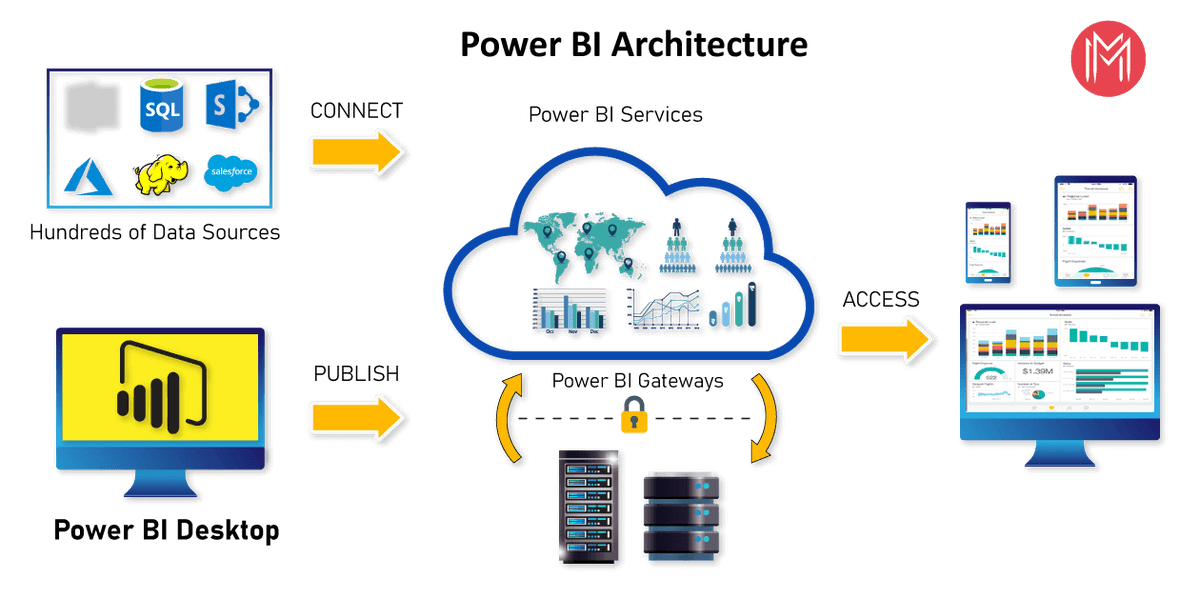
Required Components:
The Structure or architecture of Power BI mainly revolves or depends largely on the following components:
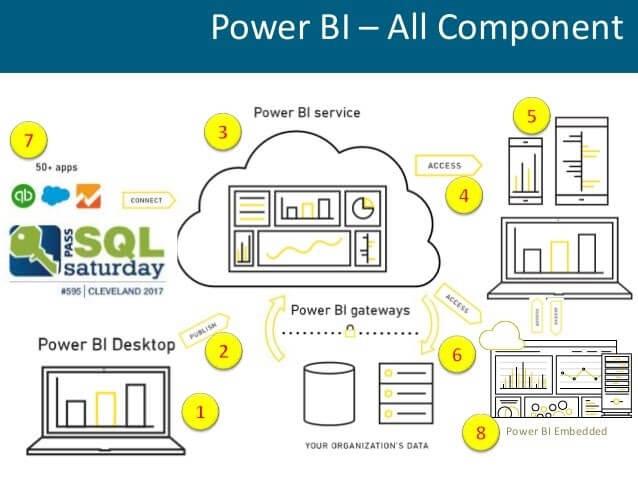
1. POWER BI DESKTOP.
2. DATA SOURCES.
3. POWER BI SERVICE.
4. POWER BI GATEWAY.
5. POWER BI REPORT SERVER.
6. POWER BI EMBEDDED.
7. POWER BI MOBILE APPS.
8. POWER VIEW.
9. POWER BI QUERY.
10. POWER PIVOT.
11. POWER Q&A.
12. POWER MAPS.
How does Power BI Work?
The process in which Power BI works is relatively easy to understand as there are no complex steps involved. Here are 4 steps on how Power BI works:
-
INTEGRATION OF DATA: As the first step in the working of Power BI, data from various sources, serves, and dashboards are collected and compressed as the maximum limit to import is only 1GB [Free version]. The compressed data will be transferred to a standard format for storage at the “Staging Area.
-
TRANSFORMATION OF DATA: Apart from the visual effects of the data, it has to be first cleaned and checked for any missing or redundant, or duplicate values or should be pre-processed. These are then loaded in and saved in data warehouses.
-
REPORT & PUBLISHING: The user can prepare various reports like graphs, charts, and others, in reference to the data stored, in their Power BI Platforms and publish them in On-premise Power BI Server and also in Power BI Services.
-
DASHBOARD AND ITS CREATION: Dashboards are created in order to withhold the individual elements in the data and these are usually performed after publishing the reports of the respective transformed data to Power BI Services.
Visit here to learn Power BI Online Training in Hyderabad
Key Terms and DataSource:
Power BI application has various key terms and data sources that are for carrying out its functions. As soon as a user opens Power BI this is what they will see:
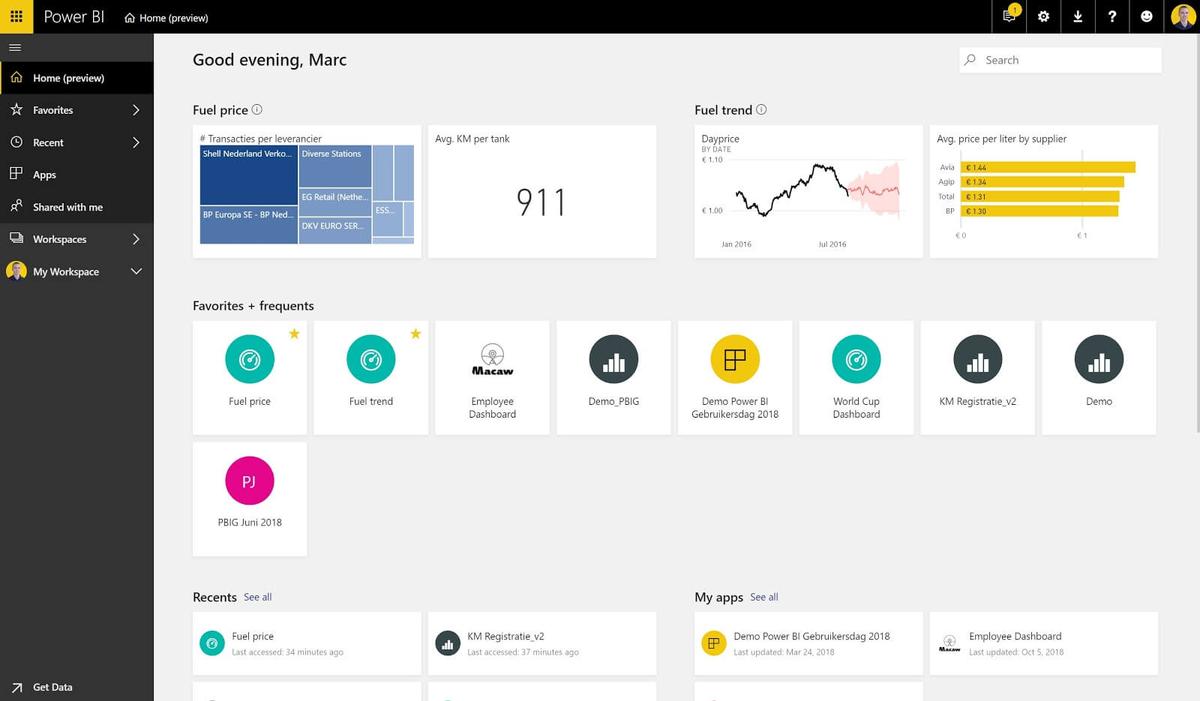
The above picture depicts the new Homepage of Power BI.
Power BI also consists of Dashboards, Datasets, Dataflows, Reports and Workbooks which are created using Capacities [Shared/Dedicated] and are all placed and maintained in Workspaces [My Workspace/ Workspaces].
Various Data Sources Used in and For POWER BI:583 290
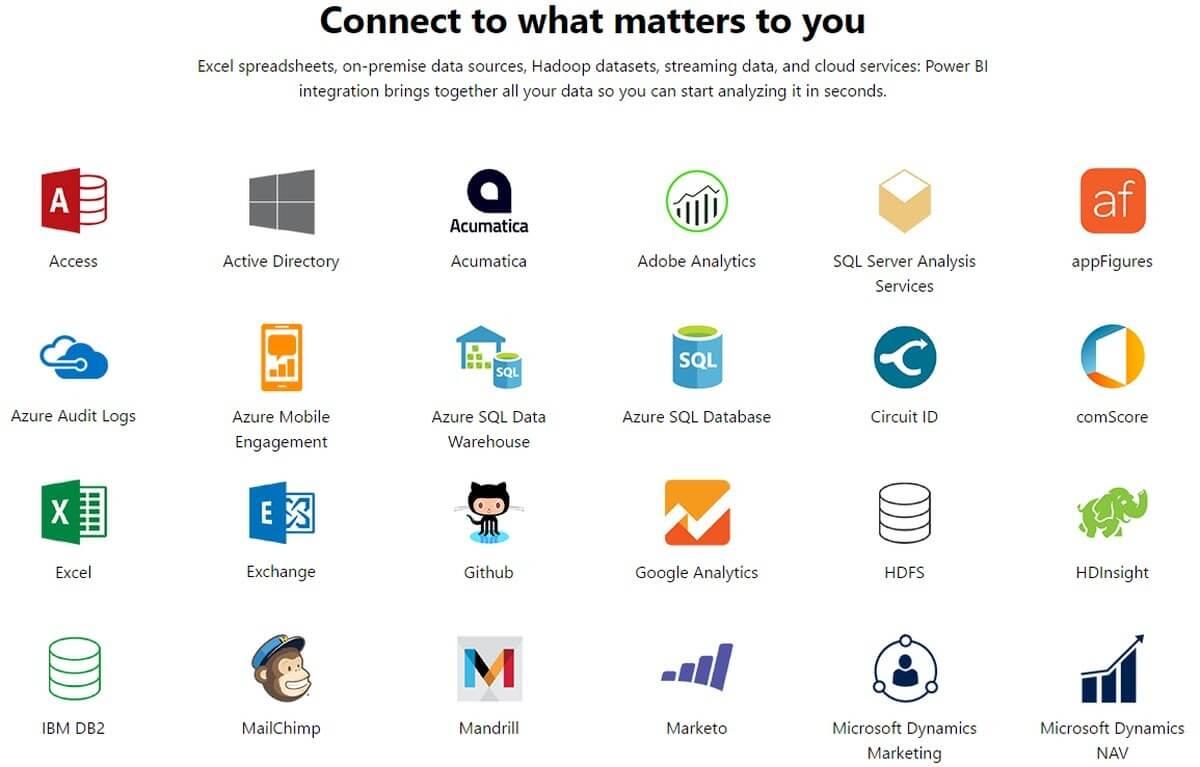
List of Data Sources of Power BI:
-
Comma Separated Value (.csv)
-
Excel (.xlsx , xlxm)
-
Databases On-Premises
-
Power BI Desktop (.pbi)
-
Cloud Database
-
OData Feed
-
Flat Files
-
Blank Query
-
Online Services
-
SQL Database
-
Azure Cloud Platform
[Related Article: Power BI Dashboards vs Reports]
What are the Common Uses of Power BI?
Power BI has a lot of functions which makes it more useful for numerous reasons. Some of its common uses are:
- Power BI can be used to collect data from various data sources which enables one to collaborate on various datasets.
- These collected datasets are further edited, transformed, and cleaned along with certain visuals and a data model.
- The final report can, however, be shared with the other Power BI users either within the organization or outside it as well.
- Power BI can also be used to analyze the firm’s data in order to find the insights present in it for further development.
- The data models act as a great source of information and that too in various attractive ways.
- Power BI also enables the management to understand the exact and current status of their firm’s functioning by providing dashboards that are of executive content (insights) to the managers.
- Power BI can also be used to identify the trends followed in the insights and can also induce some right predictions about the firm’s work.
- In order to keep the Power BI’s users well-informed about various significant measurements and metrics. Power BI enables one to set alerts on KPIs.
- Data is all secured through granular controls that work both internally and externally, Power BI ensures data protection as well.
- Even the implementation of Power BI, its monitoring, and licensing can all be accessed by the administrators through an admin portal offered by Power BI itself.
- Power BI is also associated and connected with Office 365, Dynamics 365 and SharePoint and also with other products that are non-Microsoft like Google, MailChimp, Salesforce and many more.
Leave an Inquiry to learn Power BI Training in Toronto
Who are the Common Users of Power BI?
The most common and frequent users of Power BI are those data analysts and those professionals who deal with business intelligence in order to generate various data models. Even the management uses Power BI to analyze and monitor their firm’s functioning and growth through a clear-cut study about their employee’s performance.
The Department reps use Power BI to understand the current rate of sales and marketing in order to help develop a better forecast.
Here is a list of professionals who frequently use Power BI:
-
IT Team and Professionals
-
Project and Portfolio Manager [PMO]
-
Data Scientist
-
Database Administrator
-
Developer
-
Business and Data Analyst and
-
End-User Report’s consumer

Types of Power BI Users:
| S.NO | TYPE OF CUSTOMER | USAGE |
| 1 | Report Consumer | Power BI is used to gather reports to gain specific information in short, without much detail. |
| 2 | Report Analyst | The collected data are analyzed to draw insights. The spreadsheet, cross filters, and report filters are all used. |
| 3 | Self-Service Data Analyst | Uses Power BI to handle and understand larger data volumes. They also interpret a pre-built data model to either create them or to share it with new insights. |
| 4 | Basic Data Analyst | Creates his/her own datasets using Excel but misses on important data in the models that already exist, instead is enriched in their own spreadsheet. |
| 5 | Advanced-Data Analyst | Unlike the Basic Data Analyst. The Advanced data analyst uses data sources that are both managed and unmanaged to create his own data models. This data analyst is also an expert in data modeling, analysis, and structures. On the whole, a new insight is drawn from the old and new data, put together. |
It is important to understand these major types of Power BI users in order to categorize the employees in your firm accordingly and generate work accordingly as well.
Major Companies Using Power BI:
Here are only a few major companies who use Power BI on a large scale:
-
AgileBI
-
Data Bear
-
Adobe
-
DELL
-
Capgemini
-
Nestle
-
Nuevora
-
Exelon and
-
Grant Thornton LLP
How to Install and Run Power BI Desktop?
The steps involved in installing and running Power BI in your systems or devices is quite easy as there are no complex steps involved as all one needs to do is to go to the official Power BI site and Power BI download, developed by Microsoft.
After going to the website, the “DOWNLOAD FREE” option should be clicked, after which the “GET” option should be chosen on the new page. Once this is done, the ‘INSTALL’ option has to be selected and the license agreement should be agreed upon, the destination folder to save the application must be chosen as well.
Even when the App is downloaded, one has to REGISTER in order to RUN it. Now, Power BI Desktop is ready for use.
[ Related Page: Power BI vs Tableau ]
Is Tableau is Better than Power BI?
Power BI and Tableau are quite similar but in terms of efficiency and effectiveness, they differ on different scales. While Tableau was established by Mountain View in 2003 in order to carry out various Data analyses, Power BI was developed by Microsoft in 2013 for Data analysis, Data collection, and Data transformation along with publication.
Tableau is, however, an older version when compared to Power BI and this makes it more prone to offer full support while Power BI offers only limited support. In terms of infrastructure, Power BI works only on SaaS while Tableau is flexible.
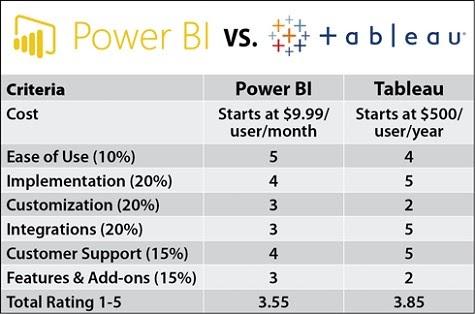
Though Tableau seems to have scored more than Power BI, it has its own disadvantages to pull it down. Power BI is also a well-developed BI software that is also growing every day. However, there’s no clear winner here which makes both winners in their own way.
One can choose either Tableau or Power BI based on their requirements and needs and this is the best conclusion that can be drawn from this comparison.
Pricing and Market Share of Power BI:
Power BI is one of the famous BI solutions which is also affordable which makes it more approachable and famous. Power BI usually has 3 plans namely: Free, Pro and Premium.
Power BI Desktop is called the free version and can be used by small level users, Power BI Pro can be used by moderate level users and Power BI Premium, as the name suggests is more suitable for enterprise-level users.
However, the rate of Power BI Pro is $9.99 per user per month while the rate of Power BI Premium varies according to the number of users and also the level of deployment.
Power BI Pricing
Apart from these 3 versions, Power BI Embedded is also considered to be a different version of Power BI which can be accessed after paying a price that deals with cost-per-hour features. The rate of this version depends on the “node” chosen by the users as each node type has a different set of processing power.
Note: All these price packages include the licensing cost as well. Therefore stay cautious of any fraudulent activities as there is no separate pay for Power BI licensing.
Details about Power BI Market:
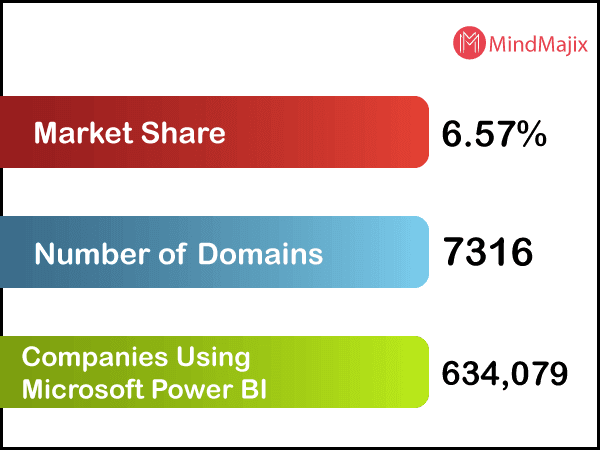
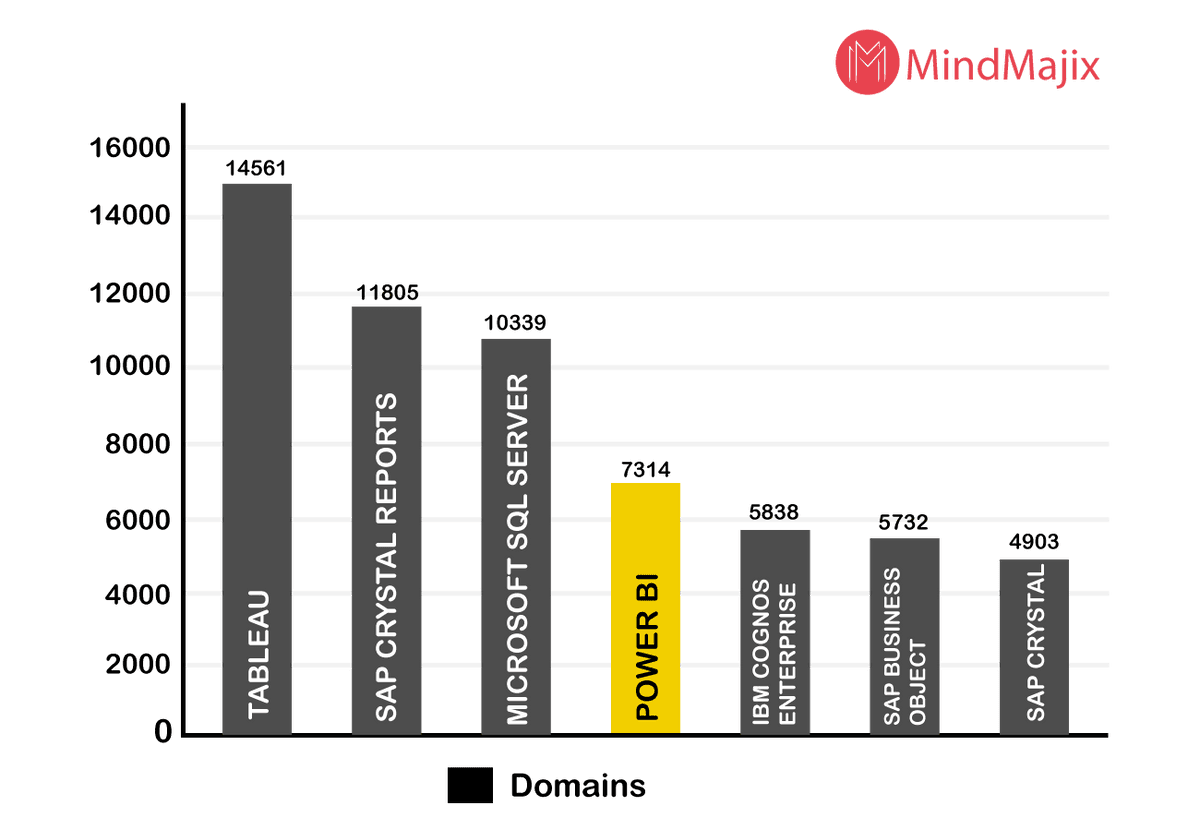
Power BI is stated to have a relatively moderate share in the overall market for BI products.
Here is a graph that showcases the market share of Power BI along with its other competitors:
Scope of Power BI in the Future:
The future of Power BI is bright as it is growing rapidly every day, both internally and externally, and is evolving as the Data Visualization and BI leader in the international market. With this name and the merit of being a big brand’s (Microsoft) product, the demand for Power BI is never going to drop, at least not in the near future.
The recent update of Power BI that happened in 2014 has emerged Power BI as a tool that’s available for almost all and has also made it possible to access it both in mobile devices and in the desktop as well.
Another factor adding to the growth of Power BI’s demand is the feature of Power BI that enables it to act as the perfect substitute for Excel users which leads to an increase in the user’s count as well. All of these factors make Power BI an unstoppable application in the fast-growing techno-driven world.
Scope for Career Opportunities as a Power Bi Developer:
Career scopes related to Power BI are as effective as Power BI’s scope of growth as they are both interlinked and are directly proportional as well. One who is interested in Power BI applications can pursue a career as a Data Analyst / as a Business Analyst / as a Business Intelligence Architect / even as a Power BI Developer.
In order to be unique and different from the crowd, one can also complete different certifications on Power BI, like MCSA and MSCE. IBM has published a report saying the scope or the demand for Data developers, data scientists and data engineers in companies will rise to around 700,000 in number by 2020.
Therefore, the Power BI career scope seems sound and effective which calls for immediate action and training in Power BI.
Learn Power BI Online Training in Bangalore
Conclusion:
Power BI is a Business Intelligence tool that is created and maintained by Microsoft just to make data collection, data analysis, data modeling, data warehousing, data visualization, dashboard configurations, report making, and data sharing an easy task.
These work on SaaS platforms around various plans and versions with their own merits and demerits, thereby encouraging users with various demands to use Power BI to meet their needs. 2020 is going to be the year of Power BI, even in terms of career opportunities.
Are you interested to learn Power BI and build a career in BI and Data visualization? Then check out our Power BI Training and Certification Course at your near Cities
These courses are incorporated with Live instructor-led training, Industry Use cases, and hands-on live projects. This training program will make you an expert in Power BI and help you to achieve your dream job.
 On-Job Support Service
Online Work Support for your on-job roles.

Our work-support plans provide precise options as per your project tasks. Whether you are a newbie or an experienced professional seeking assistance in completing project tasks, we are here with the following plans to meet your custom needs:
- Pay Per Hour
- Pay Per Week
- Monthly
| Name | Dates | |
|---|---|---|
| Power BI Training | Apr 22 to May 07 | View Details |
| Power BI Training | Apr 26 to May 11 | View Details |
| Power BI Training | Apr 29 to May 14 | View Details |
| Power BI Training | May 03 to May 18 | View Details |

Usha Sri Mendi is a Senior Content writer with more than three years of experience in writing for Mindmajix on various IT platforms such as Tableau, Linux, and Cloud Computing. She spends her precious time on researching various technologies, and startups. Reach out to her via LinkedIn and Twitter.
- Power BI Slicers - A Definitive Guide
- How to Download and Install Power BI Desktop
- How to Share Reports in Power BI for Mobile
- Power BI Architecture: A Complete Tutorial with Diagram
- Power BI Career Opportunities
- What are the Components of Power BI?
- DAX In Power BI - Learn Power BI DAX Basics
- Power BI Tutorial - Power BI Desktop Tutorial
- Power BI Interview Questions and Answers
- Power BI Services and Benefits
- Power BI Visuals List and Chart Types
- Power Apps Interview Questions and Answers
- Power Apps Tutorial
- What is Power Apps?
- Top 15 Data Visualization Tools
- Power BI Projects and Use Cases
- Power Pivot vs Power Query
- Power BI Vs QlikView
- Power BI Heatmap
- Power BI Gateway - Power BI Gateway Architecture
- Power BI vs SSRS - What are the Differences
- Power BI Dashboards vs Reports - Which is better?


